
Earth at night, city lights across Europe, Africa and Asia

The NewRulesof Capital

How value is created, captured, and compounded in a more complex world

Published 21 October 2026Begin reading
Per Franzén, CEO and Managing Partner, EQT

A note from Per Franzén

“This is a pivotal moment to be an investor.”

There is a tangible need to modernise and expand infrastructure globally, raise productivity in the real economy, and adopt and scale new technologies. Simultaneously, long-term savers face widening retirement readiness gaps and governments need private capital to complement public balance sheets.

As private markets investors, this backdrop is both energising and humbling. But we cannot be complacent: the alpha-generating capabilities of previous decades may not be fit for the future. We must always strive for better.

That’s why we have taken a moment to step back and reflect on the long-term implications of the secular shifts underway, using this report to identify the challenges and opportunities ahead.”

Per FranzénCEO and Managing Partner, EQT

Behind the research

30+interviews with CIOs, CEOs and partners at major capital allocators
300+companies in EQT’s global portfolio, showing how businesses are responding in real time
10data exhibits, validated with external research partners

Many portfolios were built for stable geopolitics, cheap and abundant liquidity, predictable diversification, and public markets at the centre of price discovery. That world has changed. The risk now is false reassurance: portfolios that look diversified and robust, but are exposed to the same underlying shocks.

If you rebuilt your portfolio today from first principles

would it look the same?

Five shifts. Structural, visible, and already under way.

As the old world gives way to the new, everything can feel uncertain. It isn’t. These forces point to a different set of conditions for how capital is deployed, how value is created, and how returns are generated.

  1. 01

    More multipolar, and more interdependent

    Roughly half of global trade now takes place between aligned blocs. Yet dependencies in services, technology and critical commodities are deepening.

  2. 02

    AI: energy-fed and adoption-led

    Returns are likely to accrue to bottlenecks, enablers, and the operators who turn adoption into measurable productivity.

  3. 03

    New industries where winners are yet to be made

    Twelve industries went from under 10 percent of global economic profit in 2005 to roughly half by 2019.

  4. 04

    High-growth opportunities increasingly sit off public benchmarks

    Around half of global profits sit in private businesses, and companies are staying private for longer.

  5. 05

    New sources of capital are reshaping competition for assets

    Sovereign wealth funds in the Gulf alone manage more than $5 trillion, up 60 percent since 2020.

What the shifts mean for portfolios

Three consequences

The shifts are not abstract. They change what a portfolio actually owns, where its risk comes from, where value accrues, and where its growth comes from. Three stand out. Each is explored in turn below.

  1. DiversificationYou can diversify your portfolio and still own the same risk
  2. Where AI value accruesAI’s biggest winners may not be AI companies
  3. Public and private marketsHalf the world’s profits are private. Most portfolios aren’t.
01Diversification

You can diversify your portfolio and still own the same risk.

A portfolio spread across regions may still rely on the same semiconductor supply chains, the same energy inputs, or the same policy pathways.

For decades, diversification rested on stable relationships: equities and bonds offset each other, geography spread risk, sectors differed. Those assumptions held in a world driven mainly by monetary cycles. They hold less well when shocks come from inflation, policy and real-world constraints, and when a portfolio spread across regions still depends on the same supply chains and energy inputs.

Exhibit 4

Private markets have historically better translated geographic diversification into returns

By region, 2010 to 2024. Public market average annual total shareholder return, and private equity median IRR

Public markets, average annual TRSPrivate equity, median IRR
Public market average annual total shareholder return and private equity median IRR by region, 2010 to 2024
RegionPublic markets, average annual total shareholder returnPrivate equity, median IRR
North America14%16%
South and Central America1%11%
Europe7%15%
Middle East and Africa6%13%
Asia Pacific7%12%

Source: PitchBook; McKinsey Value Intelligence Platform; Preqin. Private equity: median IRR for vintages 2010 and later that have been fully called; funds with mixed geographic focus excluded. Public markets: top 20,000 companies by market capitalisation; MSCI North America, MSCI EM Latin America, MSCI Europe, MSCI Arabian Markets and MSCI AC Asia Pacific. The two measures are calculated differently and are shown side by side as the report presents them.


Two workers beside power equipment under transmission towers

“You now have to diversify your diversifiers.”

A CIO interviewed by EQT

What matters now is underlying exposure, not the asset-class label. For example:

Energy dependencyGrid-connected, off-grid, or fuel-agnostic
Technology positionBottleneck owner, or bottleneck dependent
Value creation leverOrganic growth, M&A-driven, or operational transformation
Policy exposureRegulated or unregulated; single-jurisdiction or multi-market
“Geography doesn’t diversify you if the underlying dependencies are the same.”

A CIO interviewed by EQT

Aerial view of rows of yellow school buses
02Where AI value accrues

AI’s biggest winners may not be AI companies.

AI could unlock between $3 trillion and $6 trillion in incremental value by 2030. The returns are unlikely to be evenly spread.

Value creation is likely to develop as a barbell. At one end sits the physical infrastructure: compute, data centres, power, cooling and networks. These are systems with binding constraints. Access to energy, grid capacity, permitting and land determines where capacity can be built, and how quickly it can scale.

At the other end sit the businesses that turn AI into measurable gains in output, cost and speed. In between, where valuations are highest, cost curves are moving and capabilities are converging. The durability of advantage there is still unclear.

Exhibit 2

AI could unlock up to $6tn in incremental value by 2030

Capital need, valuation and value pool across three layers of the AI value chain. Hatched sections show the upper end of a range.

AI capital needs, model valuations, and estimated end use value pools
Exhibit sectionLayerMeasure and unitValue
Data centresData centresCapital need to 2030, $bn5,200 (highlighted)
Data centresFoundation modelsCapital need to 2030, $bn500–700
Data centresEnd-use segmentsCapital need to 2030, $bn200–500
Foundation modelsData centresApprox. revenue multiple, EV/revenue 20258–15x
Foundation modelsFoundation modelsApprox. revenue multiple, EV/revenue 202525–30x (highlighted)
Foundation modelsEnd-use segmentsApprox. revenue multiple, EV/revenue 2025Not assessed (not assessed)
End-use segmentsData centresEstimated value pool 2030, $bn200–400
End-use segmentsFoundation modelsEstimated value pool 2030, $bn40–120
End-use segmentsEnd-use segmentsEstimated value pool 2030, $bn3,000–6,000 (highlighted)

Source: Analysis based on McKinsey; Yole Group; Valueinvesting.io; Sacra / Anthropic; Fortune; McKinsey MGI; IMF; Eurostat; Grand View Research. Each panel uses its own scale. Value pools are EBITDA estimates.

Rows of server racks in a data centre
Bert Jansens

“AI is not interesting because it saves 10 percent on the back office, although that adds up. It gets interesting when it takes a workflow that used to take nine months and compresses it into two days.”

Bert JansensHead of Private Capital EU & NA, EQT
A ferry crossing between islands

“We are participating in the outcome,

A CIO interviewed by EQT, on
public markets

not in the value creation.”

03Public and private markets

Half the world’s profits are private. Most portfolios aren’t.

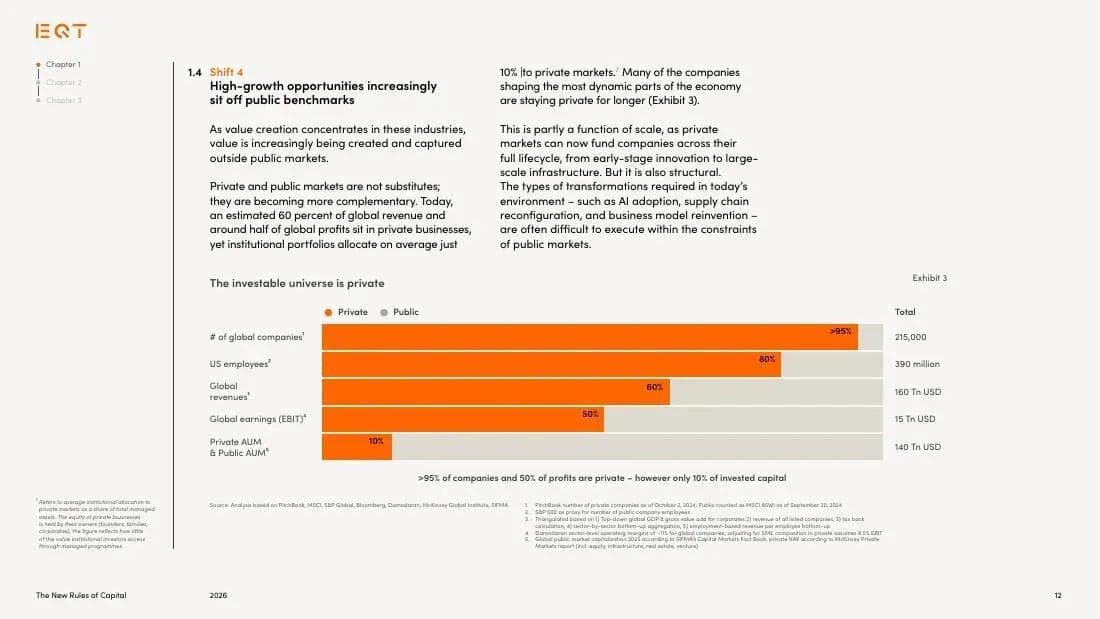
An estimated 60 percent of global revenue and around half of global profits sit in private businesses. Institutional portfolios allocate on average just 10 percent to private markets.

Many of the companies driving the most dynamic parts of the economy are staying private for longer. The number of listed companies in the United States has roughly halved since the mid-1990s. Private markets can now fund a company across its full lifecycle, from early-stage innovation to large-scale infrastructure.

Scale is only part of it. The transformations today’s environment requires, from AI adoption to supply chain reconfiguration, are often hard to execute within the constraints of public markets. Public markets remain essential for liquidity and price discovery. But they increasingly capture companies late, after much of the steepest growth has taken place.

Exhibit 3

The investable universe is private

More than 95 percent of companies and half of global profits are private. Only 10 percent of invested capital is.

Public markets, average annual TRSPrivate equity, median IRR
Private and public share by measure
MeasurePrivate shareTotal
Global companies>95%215,000
US employees80%390 million
Global revenues60%$160tn
Global earnings (EBIT)50%$15tn
Assets under management (Private and public AUM)10%$140tn

How to read this: the equity of private businesses is held by their owners, such as founders, families and corporates. The 10 percent reflects how little of this value institutional investors access through managed programmes.

Source: Analysis based on PitchBook, MSCI, S&P Global, Bloomberg, Damodaran, McKinsey Global Institute, SIFMA. Full methodology in the report and in Sources below.

Rows of solar panels under a cloudy sky

Portfolios are no longer built on allocation

The argument is not for concentration. It is that diversification itself requires more deliberate construction, based on underlying dependencies rather than labels.

but engineered.

What this asks of managers

Three capabilities will matter most

If portfolios have to be engineered rather than allocated, the managers behind them have to be built differently too.

  1. 01

    Local enough to see opportunities early, global enough to scale them

    Teams embedded in local markets identify inflection points first. A global platform turns what they find into outcomes, with the expertise, partnerships and exit options to match.

  2. 02

    Building better businesses through active ownership

    When rising asset values are no longer a tailwind, returns have to come from the company itself. Doing that repeatedly, across a portfolio, requires scale.

  3. 03

    Consistent returns, with liquidity that matches what clients need

    The test is not one strong vintage but repeated above-median performance across cycles, and capital returned when investors need it rather than when markets allow.

    Up to 30%

    Higher end-of-period MOIC over a decade for consistently above-median managers, compared with occasional top-quartile managers.

    <10%

    Of managers meet that criterion.

A framework for the CEO and CIO agenda

Seven questions to ask of your portfolio

If these shifts are structural, incremental adjustments will not be enough. The more relevant question is whether portfolios, and the institutions that manage them, are built for the world that is emerging. The full report sets out the evidence behind each question.

  1. If we rebuilt our portfolio today from first principles, would it look the same?

    Explored in the full report

  2. Are we positioned where value is being created, or where it is being realised?

    Explored in the full report

  3. Are we selecting managers based on past performance, or on their ability to deliver consistently at scale?

    Explored in the full report

  4. Are we diversifying by labels, or by underlying exposures?

    Explored in the full report

  5. Does our portfolio reflect a multipolar world in practice, not just in theory?

    Explored in the full report

  6. Do we have a clear strategy for liquidity, or are we relying on market conditions?

    Explored in the full report

  7. Are we equipped in practice to capture AI-driven value creation?

    Explored in the full report

The full report sets out the evidence behind all seven, including manager selection, multipolar portfolios and liquidity.

Access the full report
Per Franzén

“We hope it sparks a robust conversation, and we welcome the opportunity to exchange views in the coming weeks and months.”

Per FranzénCEO and Managing Partner, EQT

Exclusively for investment professionals

Access the complete research

The complete analysis, in three chapters and ten data exhibits. Drawn from interviews with more than 30 CIOs, CEOs and partners, and from EQT’s portfolio of more than 300 companies.

  1. Chapter 1The new rules of the game: five structural shifts
  2. Chapter 2Rethinking the playbook: diversification, public market concentration, and manager consistency
  3. Chapter 3The new investment technology required: localisation, business building at scale, and consistent returns with liquidity
  4. FrameworkSeven questions for the CEO and CIO agenda

Privacy Notice

Sources and notes
  1. Exhibit 3: companies from PitchBook count of private companies as of 2 October 2024; public counted as MSCI ACWI as of 30 September 2024. US employees use the S&P 500 as a proxy for public company employment. Revenues triangulated from top-down GDP and gross value added, listed company revenues, tax-back calculation, sector bottom-up aggregation and employment-based revenue per employee. Earnings based on Damodaran sector operating margins of around 11 percent for global companies, adjusted to 8.5 percent EBIT for private SME composition. AUM: global public market capitalisation 2025 (SIFMA Capital Markets Fact Book); private NAV (McKinsey Private Markets report, including equity, infrastructure, real estate and venture).
  2. The 10 percent institutional allocation refers to the average allocation to private markets as a share of total managed assets. The equity of private businesses is held by their owners (founders, families, corporates).
  3. Listed company counts: Jay R. Ritter, University of Florida, “Number of Listed Firms on US Exchanges,” 2025; OECD Corporate Governance Factbook 2025.
  4. Exhibit 2: data centre capital need reflects McKinsey’s “Continued momentum” scenario, 124 GW of incremental AI capacity added 2025 to 2030, including IT equipment, power and building costs. Foundation model capital reflects VC funding; valuations based on OpenAI and Anthropic as of March 2026; data centre multiples based on Equinix and Digital Realty. End-use value pool extrapolated from McKinsey’s US EBITDA pool estimate to the EU and China.
  5. Exhibit 4: PitchBook; McKinsey Value Intelligence Platform; Preqin. Private equity median IRR for all vintages 2010 and later that have been 100% called; funds with missing IRR or mixed investment focus excluded. Public markets: sample of the top 20,000 companies globally by market capitalisation. 2010 values are not available for all regions except North America; South and Central America 2011 is not available. The two measures are calculated differently and shown side by side as the report presents them.

  6. Consistency and MOIC: analysis based on Preqin. Share of managers meeting the criterion: SPI by StepStone.
  7. Shifts: geopolitical trade alignment from McKinsey Global Institute, Geopolitics and the geometry of global trade; industry profit concentration from McKinsey, The race takes off in the next big arenas of competition (2026); Gulf sovereign wealth from Aranca (2025) and EY (2025).
  8. Unattributed quotations are from interviews conducted by EQT with CIOs, CEOs and investors.

Important information. For professional investors only. General information, not an offer, solicitation or investment advice. Views are as of October 2026 and may change. Forward-looking statements are not guarantees. Past performance is not indicative of future results.